 Details:
ThermaViewer™
Description:
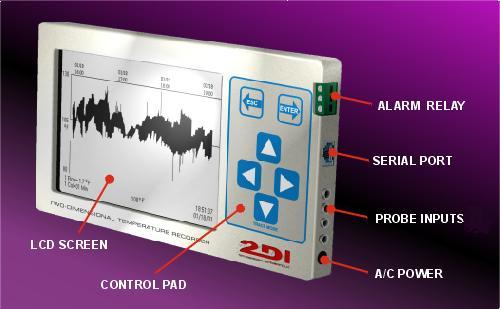
The ThermaViewer™ (patent pending), is a temperature recorder, about the size of a video cassette, that stores and graphically displays up to two years of temperatures on its LCD display. Temperature is sampled at a regular rate, typically ranging from once every fifteen seconds to once an hour, stored in battery backed-up memory, and displayed as a graph.
Details:
The ThermaViewer™ stores 113,000 data samples for each of its two channels. This means that the Data Viewer could store over 2 years of data for each channel if samples are taken every ten minutes. If samples are taken once a minute, three months of data per channel is stored.
The ThermaViewer™ displays temperature from near absolute zero to thousands of degrees F/C, depending on the probes being used.
A password protected onboard menu is used to set system and display parameters such as high and low temperatures, sampling intervals, display interval and alarm/relay levels.
The LCD is a black & white non-backlit graphic display, controlled by a microprocessor. The ThermaViewer™ is powered by 120VAC power with a 9vdc battery backup. The ThermaViewer will enter battery mode and the display will 'sleep' if the 120vac power is missing. While the display is blank the unit will continue to collect temperatures for several days. In the event that power is not restored before the 9vdc battery is depleted the stored data will still be retained for as long as five years, although data will not continue to be collected.
180 columns of data are displayed at all times. Therefore, three hours of data is displayed if data was recorded once a minute, and forty-five minutes of data is displayed if data was recorded once every fifteen seconds.
The temperature scale on the left of the display indicates the selected temperature range. The scale can be changed at any time by changing the maximum, minimum and reference temperature, which results in the graph being immediately redrawn to reflect the newly chosen values.
The time that each temperature was recorded is indicated on the date and minute lines at the top of the graph, while each column represents the selected time interval.
To view previous temperatures the user scrolls backwards through the data using the 'left arrow button'. Continuing to scroll beyond the left margin of the LCD will cause additional data to scroll into view. As the user scrolls backwards and forwards through the temperatures, the date and minute lines will change to show the stored temperature with the time they occurred.
It is possible to view more than 180 temperature values on the display at once. In the 'exploded view' each column represents one temperature. In a zoomed out mode, each column represents several different stored temperatures. A solid black vertical data bar (High-Low Bar or HL Bar) is drawn on the display with the top end of the data bar being the high temperature recorded during the interval, and the bottom end of the data bar representing the low temperature recorded during the interval; i.e. HL Bar = Delta temperature. This is identical to the bar graph used by the stock market recaps where the top of the bar is the high price for the day and the bottom of the bar represents the low for the day.
The bottom two rows of the display are system data lines. In the 'live mode', the bottom system data lines display the scale for both row and column values on the left hand side. The current temperature is displayed in the center and the current date and time are displayed on the right. (For additional information see the User's guide.)
The Numbers:
Number of Channels: 2
Sample Interval: User selectable: 15 sec - 60 min
Data Storage Interval: User selectable: 15 sec - 60 min, (Can be different from the sample rate)
Data Storage Value: Average, Maximum, Minimum, Most Frequent
Data Storage: 113,000 samples per channel depending on memory
Display Resolution: .1 Degree on LCD display. .001 on PC.
Temperatures Stored: -180 to 1500 F (Stored in 32nd of a degree C.)
Temperature ranges: Thermistor -40 to +185°F, K type Thermocouple -180 to +1500F (±1°C)
Humidity Range: 0 to 95% RH, (±2% RH at 73°F)
On Board RAM: 512kb
Storage Technique: Battery Backed-Up SRAM
Power: 120vac with emergency 9vdc battery backup (2.5 hrs- 7 days)
Output to PC: RS 232 via custom cable (DB9 to Audio plug)
Indicators: LCD & LED
Controls: Password protected onboard Menu
Values Displayed: 180 Horizontal, 90 Vertical
Measurement Range: Based on the probe being used to collect data
thermistor: -40 C to 95 C (±1°C Typical)
K Thermocouple: -100 F to 1500 F (Typical) ( ±1.5°C Typical)
LCD: Size - 2.5" x 4.5" (128x240 pixels), Graphic Display
LED: Green – indicates AC power present
Size: 8 3/8” x 5” x 1 3/8"
Weight: 1 lb
Relay: Passive 2 terminal <30 volts, .1 amps
| J & S Instruments, Inc. 3071 State Route 72 South Springfield, OH 45505-5023 |
Phone 937-325-7499 Fax 937-323-9588 sales@jsinstruments.com |